PVViewer
PVViewer is a web application for inspecting the process variable (PV) logs recorded during a neutron scattering experiment. You choose one or more run files, pick the PVs you care about, and PVViewer plots them, tabulates them, and lets you download them as CSV.
PVViewer reads recorded logs, not live values
PVViewer does not support live data. It reads logs that were already written into a NeXus file,
under the file's entry/DASlogs group.
What you can do with it
- Open several run files at once and compare the same PV across all of them on a single graph
- Search a run's PVs by name
- Read exact recorded values in a table, with one column per run file
- Download a PV's values across every open file as a CSV
The screen layout
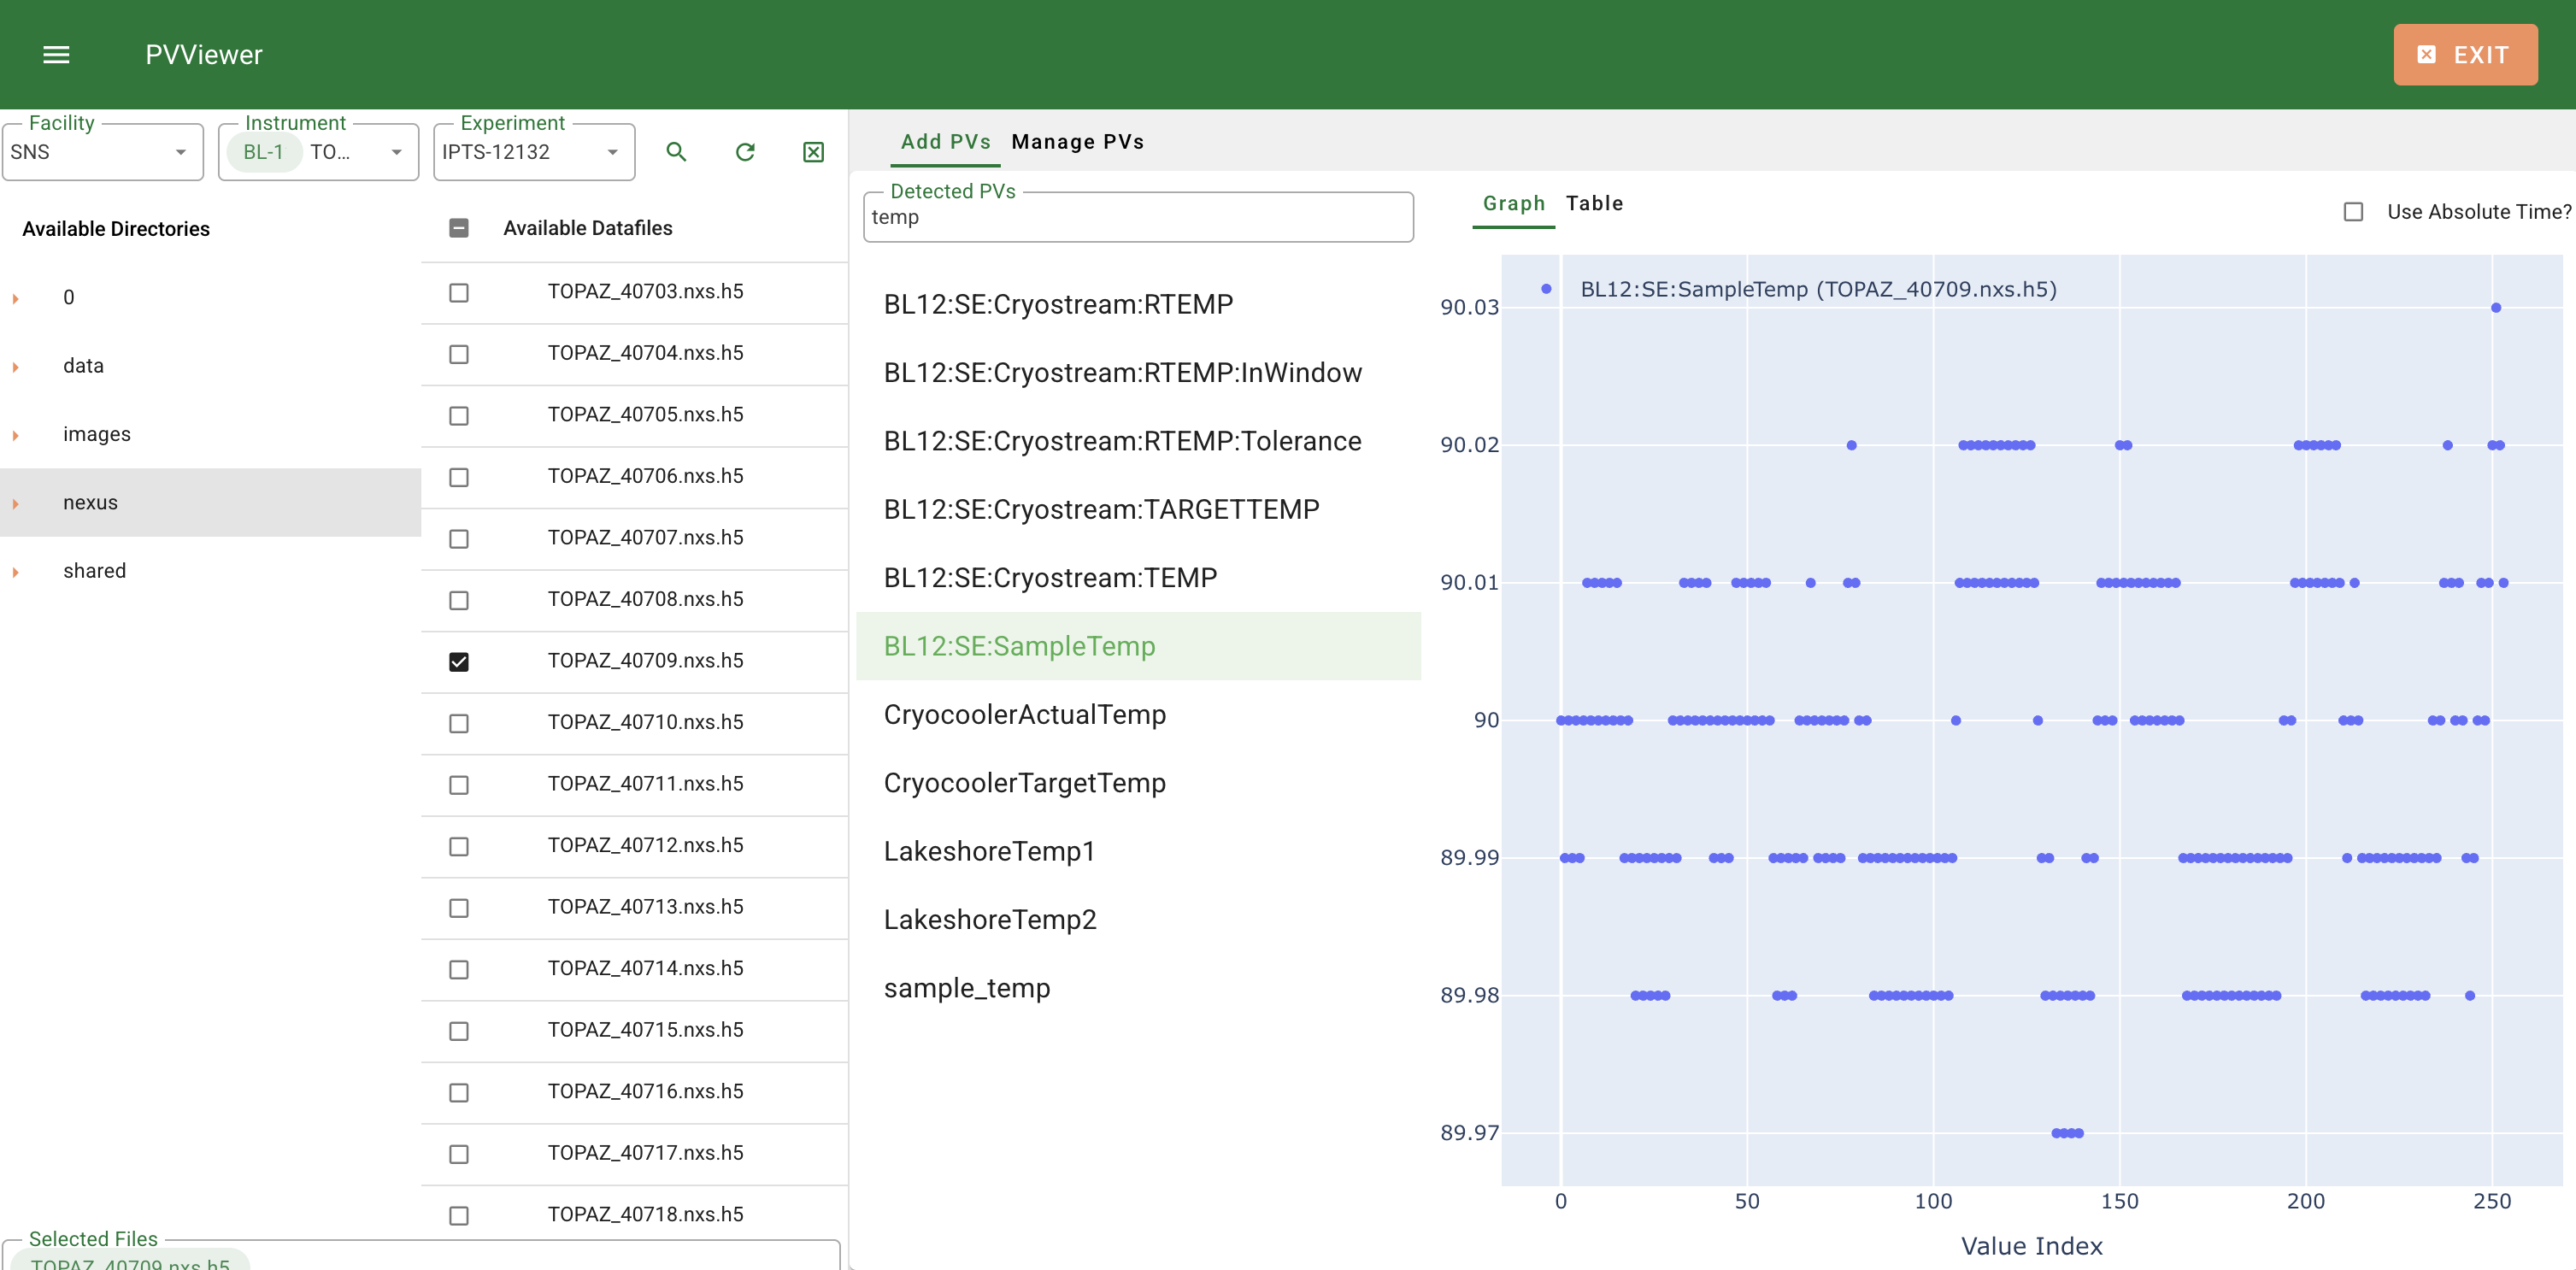
PVViewer is one screen with four regions.
+-----------------------------------------------------------------------+
|  [=]  PVViewer                                              [ Exit ]   |  app bar
+---------------------------+-------------------------------------------+
|                           |  Add PVs | Manage PVs                      |  left tabs
|   File selection drawer   +-------------------------------------------+
|                           |  Graph | Table          [ ] Use Absolute   |  right tabs
|   Facility                |                             Time?          |
|   Instrument              |                                            |
|   Experiment              |         PV tree          |     graph       |
|                           |         or PV list       |     or table    |
|   Available Directories   |                          |                 |
|   Available Datafiles     |                          |                 |
|                           |                          |                 |
+---------------------------+-------------------------------------------+
- App bar. The menu button at the far left shows and hides the file selection drawer — useful once you have your files chosen and want the full width for the graph. Exit closes the application (upon confirmation).
- File selection drawer. Opens automatically at startup. This is where you choose which run files to open.
- Left column, with the Add PVs and Manage PVs tabs. Finding PVs and controlling which ones are loaded.
- Right column, with the Graph and Table tabs and the Use Absolute Time? checkbox. Where your data is displayed.
Status messages appear briefly in a bar at the bottom of the window and disappear after about five seconds.
A typical session
- In the drawer, choose a Facility, Instrument and Experiment.
- Tick one or more files in Available Datafiles. They load immediately.
- On the Add PVs tab, type part of a PV name to filter the list, then click the PV you want. It is loaded from every open file at once.
- Look at the result on the Graph tab, or switch to the Table tab for exact values.
- Use Download on the Table tab to export a PV as CSV.
- Use the Manage PVs tab to hide or remove PVs as the graph gets crowded.